The above news was issued by the Met Office Press Office last week on Thu 23 Oct 25.
It seems that the world’s oceans and ice sheets act as a climate change fly wheel. A system set turning by current and past atmospheric changes, whose slow response to ‘locks in’ sea level rises by its own inertia. Like the proverbial super tanker, course changes will take place only slowly even when the Master is desperate to standing into danger.
So, the ‘long-lasting legacy of current emissions’ mean an inevitable sea level rise of 0.3 meters by 2300. If policies are left unchecked until 2090 the rise is calculated at about 0.8 m.
I am left thinking about what would this mean for east Kent in the UK?
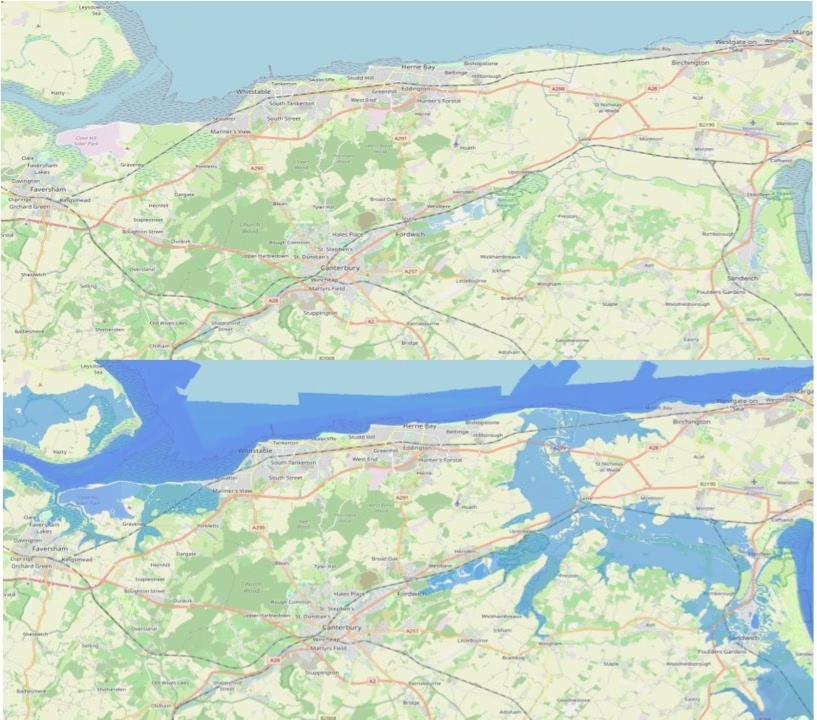
Following methodology of my post Ham’s Secret Water, which produces maps by grappling with the pot-mess of Ordnance Datum (OD), Chart Datum (CD and tidal calculations, I offer some graphics about what a sea level rise of 0.3 m or 0.8 m would mean in East Kent during a high spring tide. Just an idle exercise with QGIS and Environment Agency LiDAR.
The Environment Agency (EA) makes LiDAR digital elevation data openly available. This offers a way of overlaying elevation data on openly available maps using GIS software. EA LiDAR elevations are given relative to Ordnance Datum (OD) but tidal heights are given relative to Chart Datum (CD). It is a bit of a surprise that the difference between OD and CD is not constant; the planet’s is distorted and rough and there is no simple geometry here. CD varies by location.
The difference between OD and CD is -2.9 at Sheerness and -3.67 m at Dover (National Tidal and Sea Level Facility). The negative here indicates that CD is at a lower level than OD. Hence a spring tide in the area forecast at 4.52 m (Ramsgate 7/6/24) would, in the absence of sea defences, have the potential to flood elevations to about 1.5 m above OD.
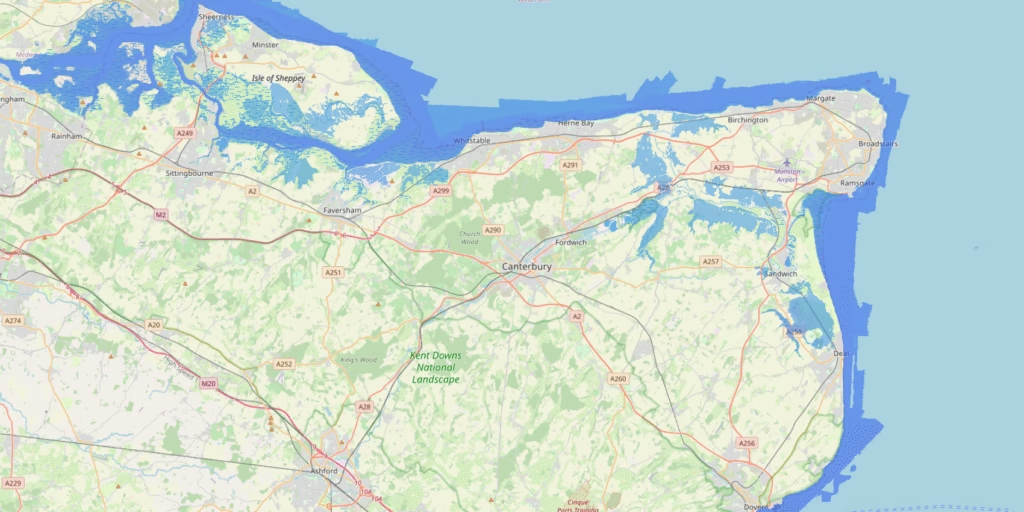
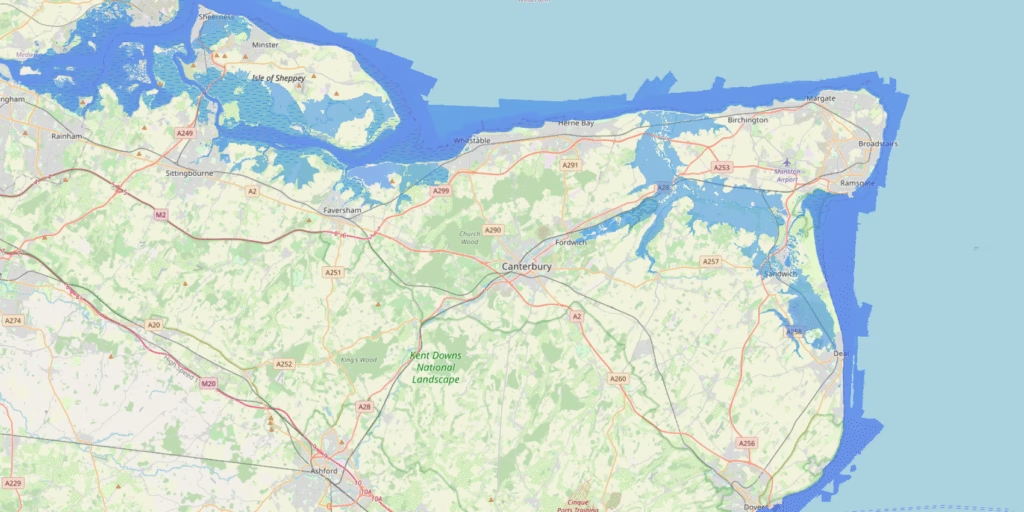
If we assumed similar tidal variations in 2300, there being no climate change effects on the gravitational pull of the moon, then spring tides would have the potential to flood parts of the landscape which now lie at 1.8 m above OD even if all climate change factors were eliminated and, 2.3 m above OD if policies were unchanged.
Overlaying EA LiDAR data and shading this to 1.8 m above OD may give the expected height of a Spring Tide on the landscape
Overlaying EA LiDAR data and shading this to 2.3 m above OD may give the expected height of a Spring Tide on the landscape
These changes of sea levels may not present an existential threat to East Kent. The common notion may be that normal and good means stable and unchanging but, in truth, the world is in flux. In fact, it seems that isostatic readjustment means that this part of the continental crust is still bobbing up after the last ice age, leaving the high-water marks of the past some distance from the coast ‘Glacial isostatic adjustment of the British Isles: new constraints from GPS measurements of crustal motion‘.
Perhaps the shores of Kent Anglo-Saxon Riviera will return.