Following my recent post, Flooding up the Wantsum Channel on Mudge’s Map, I thought I would repeat the analysis only using Open Street Map, rather than a historical map. This may make it easier to visualise the probable location of the Wantsum Channel based on the current position of settlements and infrastructure.
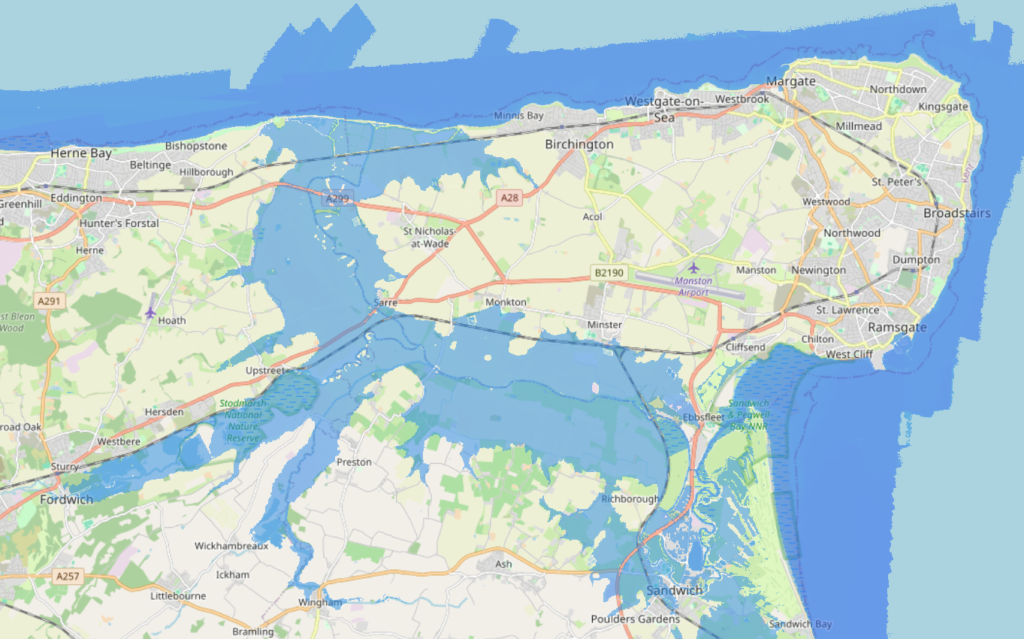
I have produced the flooding effect by overlaying Environment Agency (EA) LiDAR shaded in steps from a minimum elevation value of 0 m to a maximum value of 2.75 m. In choosing 2.75 I considered how the elevation level related to settlements given on the OS 1888-1913 series of maps. The assumption here was that the location of settlements should be on dry land with the Channel flooded whilst giving decent access to Fordwich by boat.
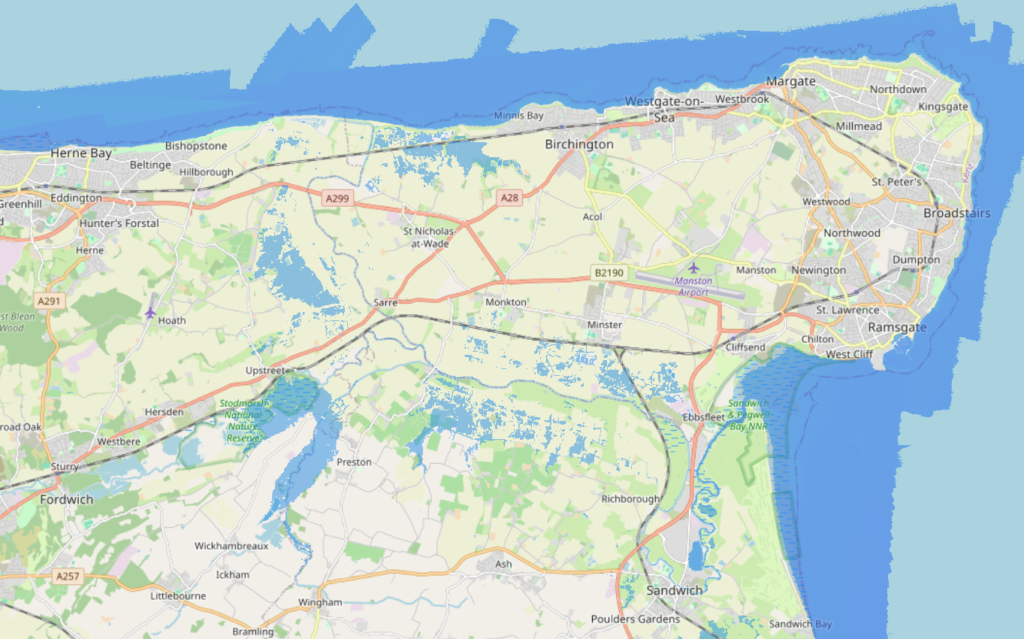
Another way to read the graphic is as a warning showing low areas at risk of flooding. It should be noted that there is not much in the way of built infrastructure on the marsh, see Searching for the Kent’s Wantsum Channel on Historic OS Maps. The question arises about the height of the tide needed to flood the Wantsum Channel in the absence of sea defences and the sea wall.
EA LiDAR elevations are given relative to Ordnance Datum (OD). Tidal heights are given relative to Chart Datum (CD). It is a bit of a surprise that the difference between OD and CD is not constant; the surface of the planet is distorted and rough and there is no simple geometry here. CD varies by location.
The difference between OD and CD is -2.9 at Sheerness and -3.67 m at Dover (National Tidal and Sea Level Facility). The negative here indicates that CD is at a lower level than OD. Hence a spring tide in the area forecast at 4.52 m (Ramsgate 7/6/24) would, in the absence of defences, have the potential to flood elevations to about 1.5 m above OD. Areas below 1.5 m are shaded in the following graphic.
An image of the Wantsum Channel based on elevations of 2.75 m is as follows. This must show the probable medieval coastline.