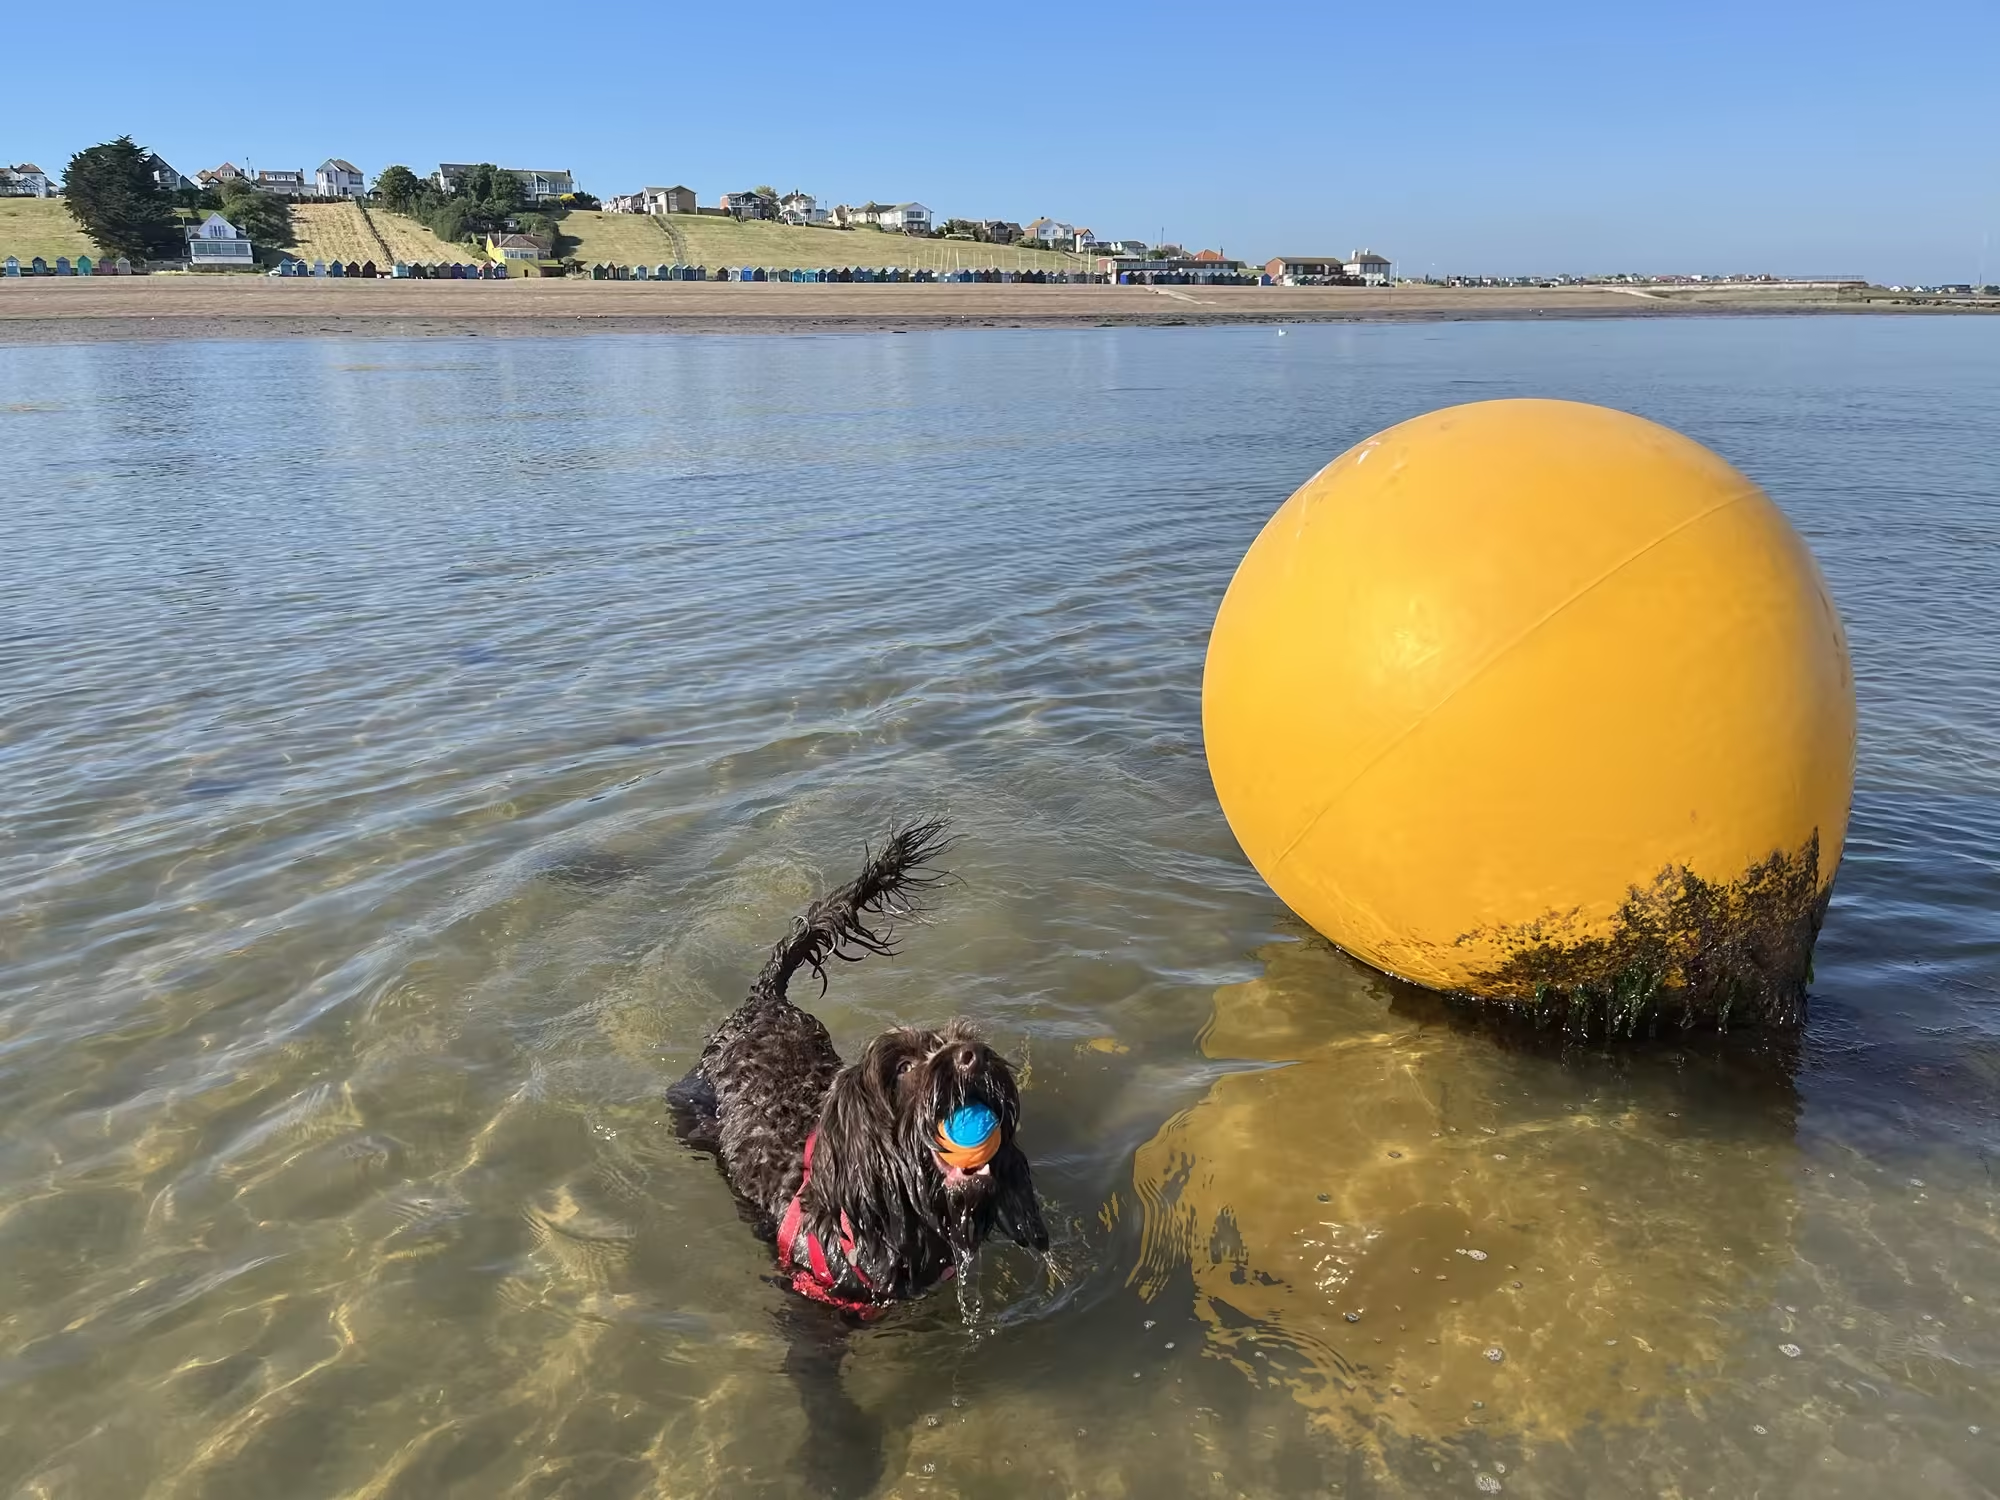
Low tide safari, Herne Bay.
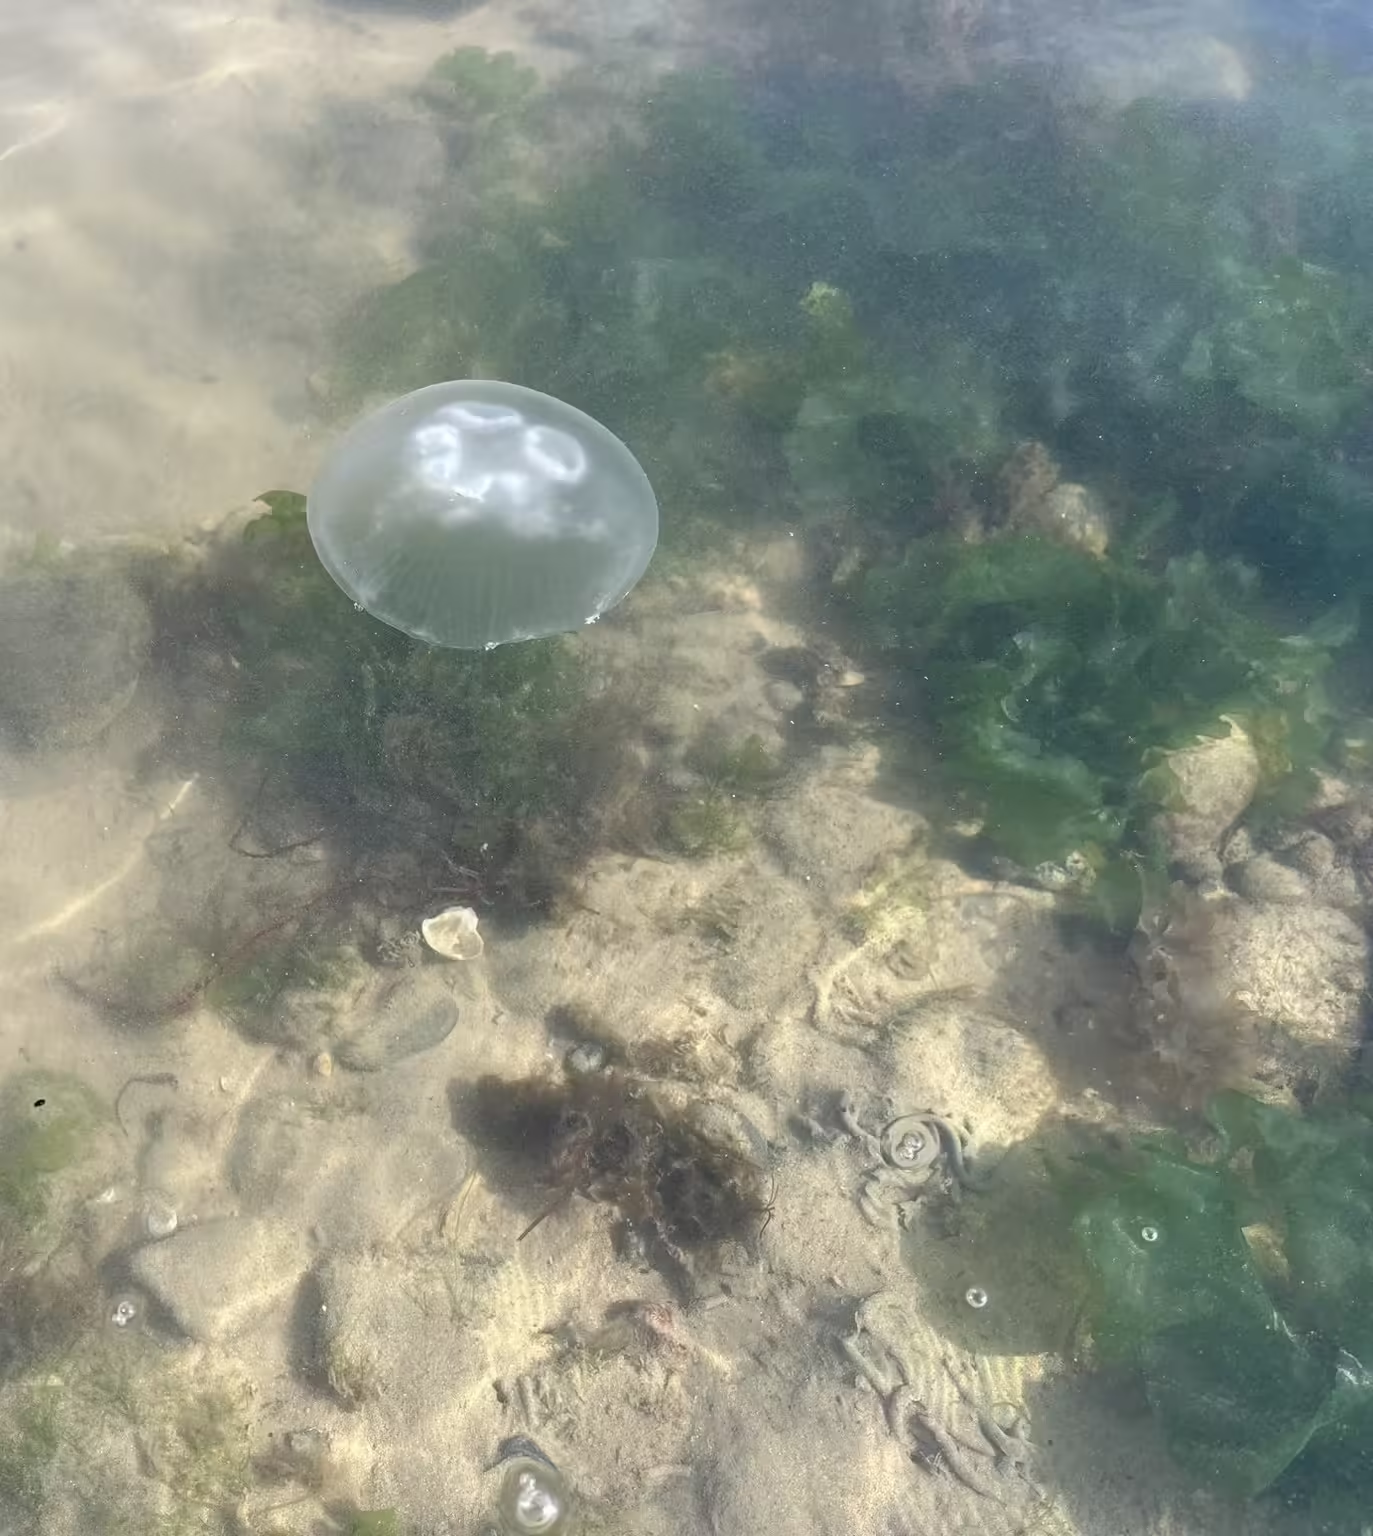
Just photos of weed and jelly fish seen at low tide on west beach, Herne Bay.
weather, climate, geographic information systems for Kent, UK and global
Just photos of weed and jelly fish seen at low tide on west beach, Herne Bay.
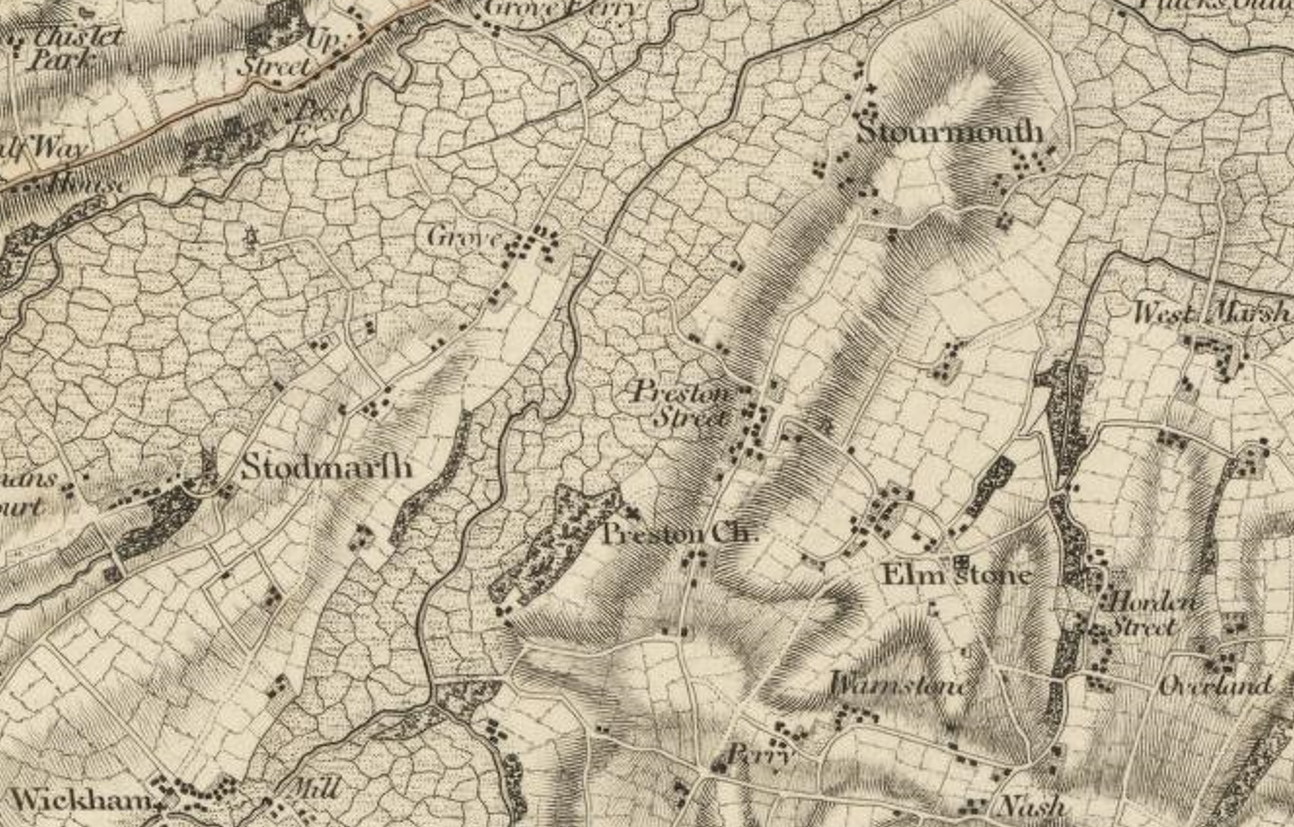
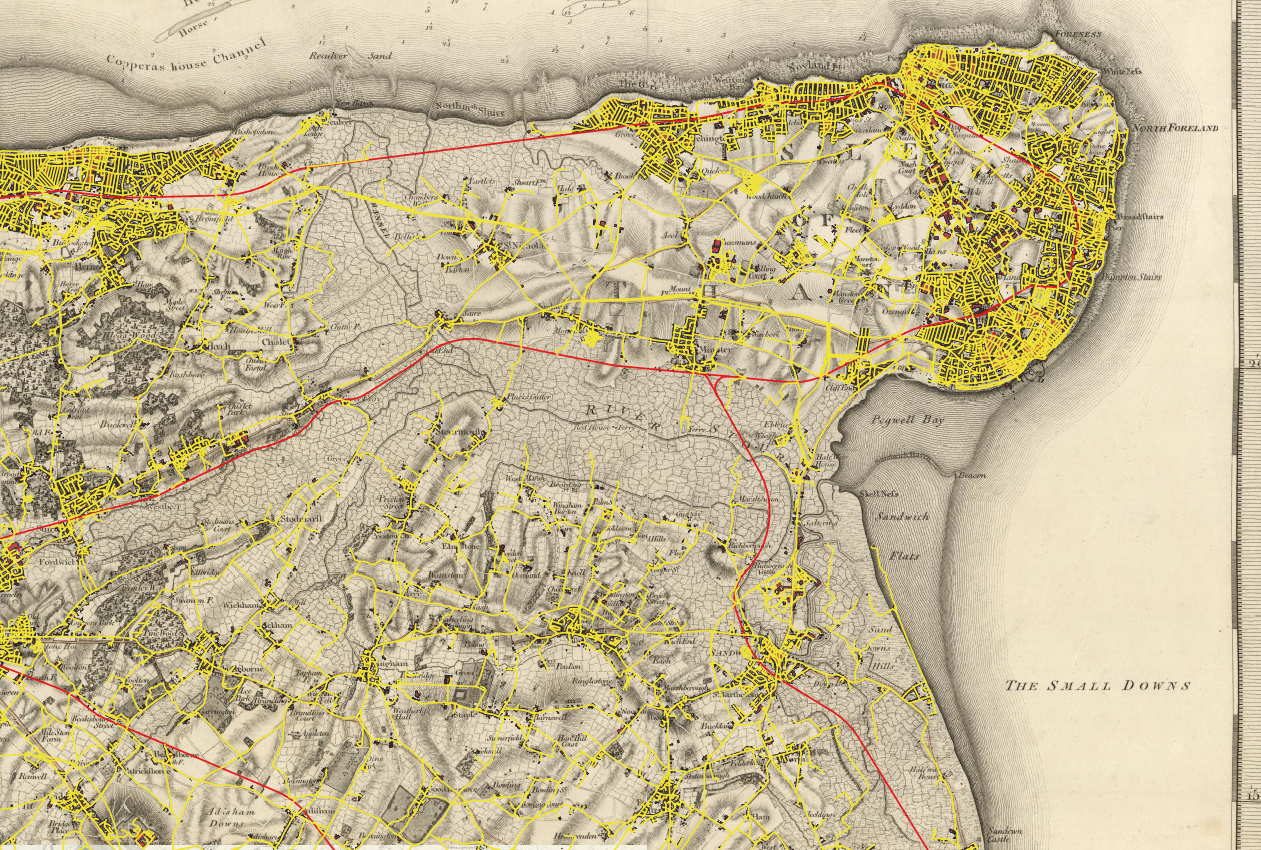
Preston, East Kent, is shown above on the Ordnance Surevy’s first published map of Kent in 1801, The County of Kent – map by William Mudge 1801, the first map published by the Ordnance Survey. I think that the area covered by the Wantsum Channel is essentially the marshes that are indicated so clearly on … Read more
This post presents and animation of how the Wantsum Channel would look on Open Street Map by shading different elevations of Environment Agency sourced LiDAR data. A conclusion of the post is to present a possible medieval East Kent Coastline based on an elevation of 2.75 m.
A micro climate between the beach huts and the sea wall.
This post presents and animation of how the Wantsum Channel would look on Mudge’s 1801 map by shading different elevations of Environment Agency sourced LiDAR data. A conclusion of the post is to present a possible medieval East Kent Coastline based on an elevation of 2.75 m.
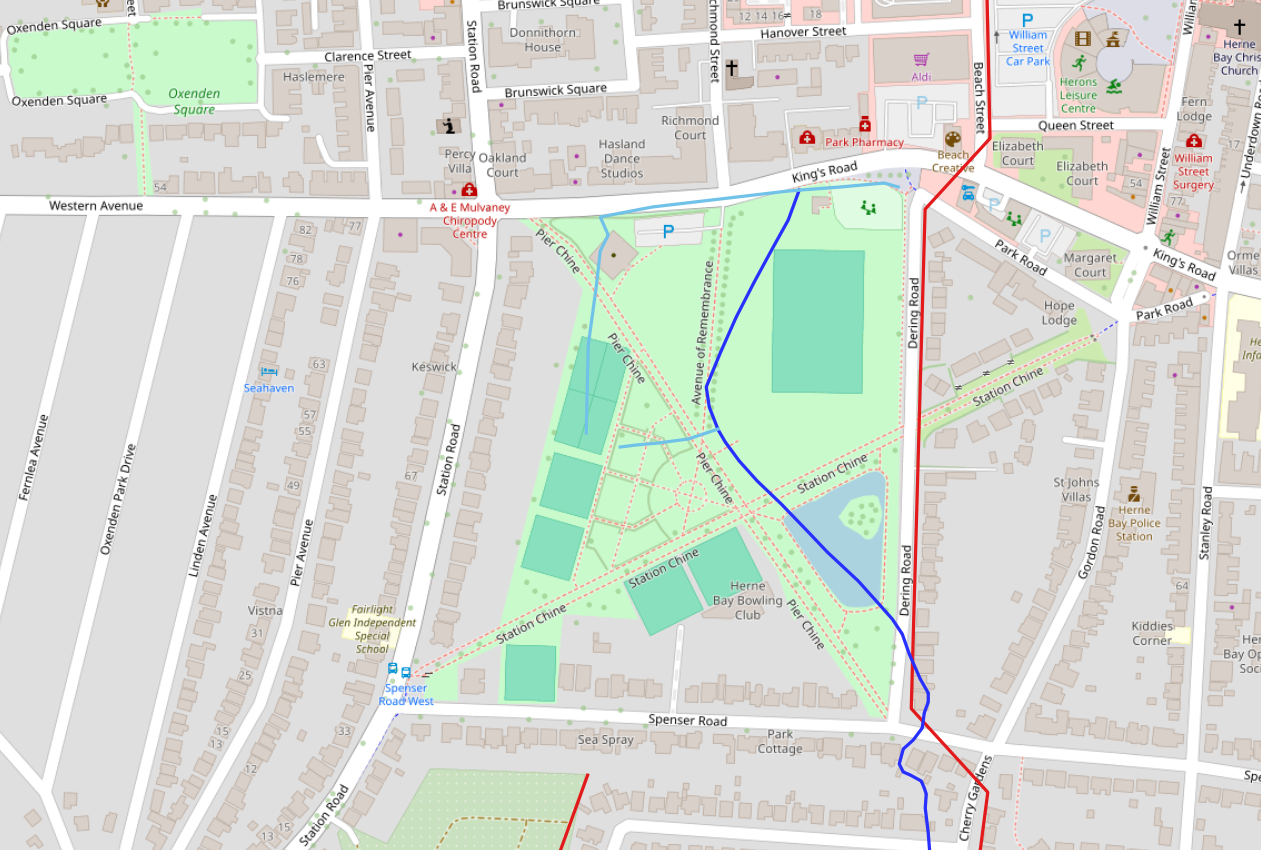
This post presents the historical location of the Plenty Brook as it passed through the Herne Bay Memorial Park area prior to the development of the site.
An exploration of historical maps and modern OS data layers to find the Wantsum Channel.
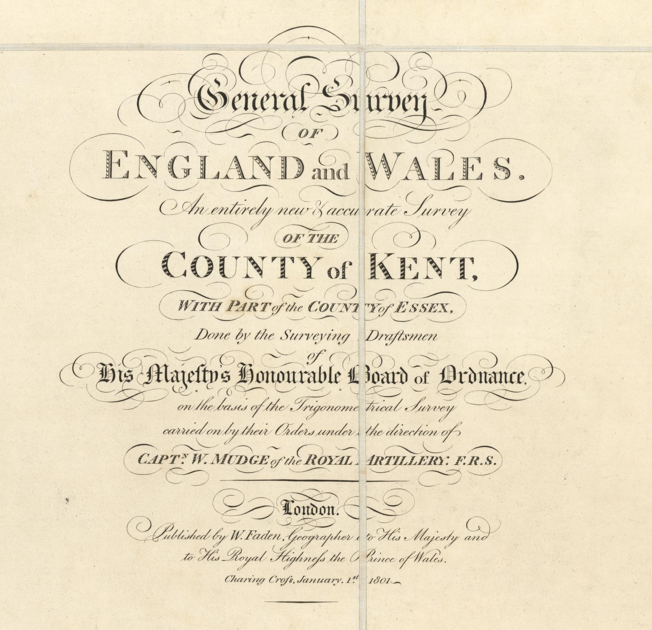
Introducing Capt Mudge RA’s first published Ordnance Survey map as found on the David Rumsey Map Collection website. The map is embedded here and the reader can pan and zoom from this post.
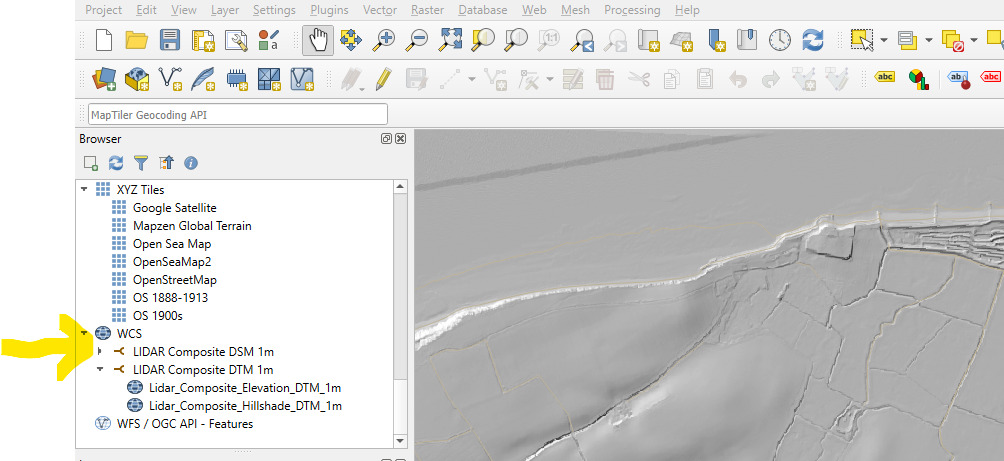
a short note about LIDAR and how to connect QGIS to LIDAR data released by the UK Environment Agency.