Long term sea level rise legacy for East Kent
long term sea level rise, locked in by slow changes in oceans and ice sheets, has implications for Kent coastline
weather, climate, geographic information systems for Kent, UK and global
Jim Dickson blog content involving the use, visualisation and analysis of LiDAR data.
long term sea level rise, locked in by slow changes in oceans and ice sheets, has implications for Kent coastline
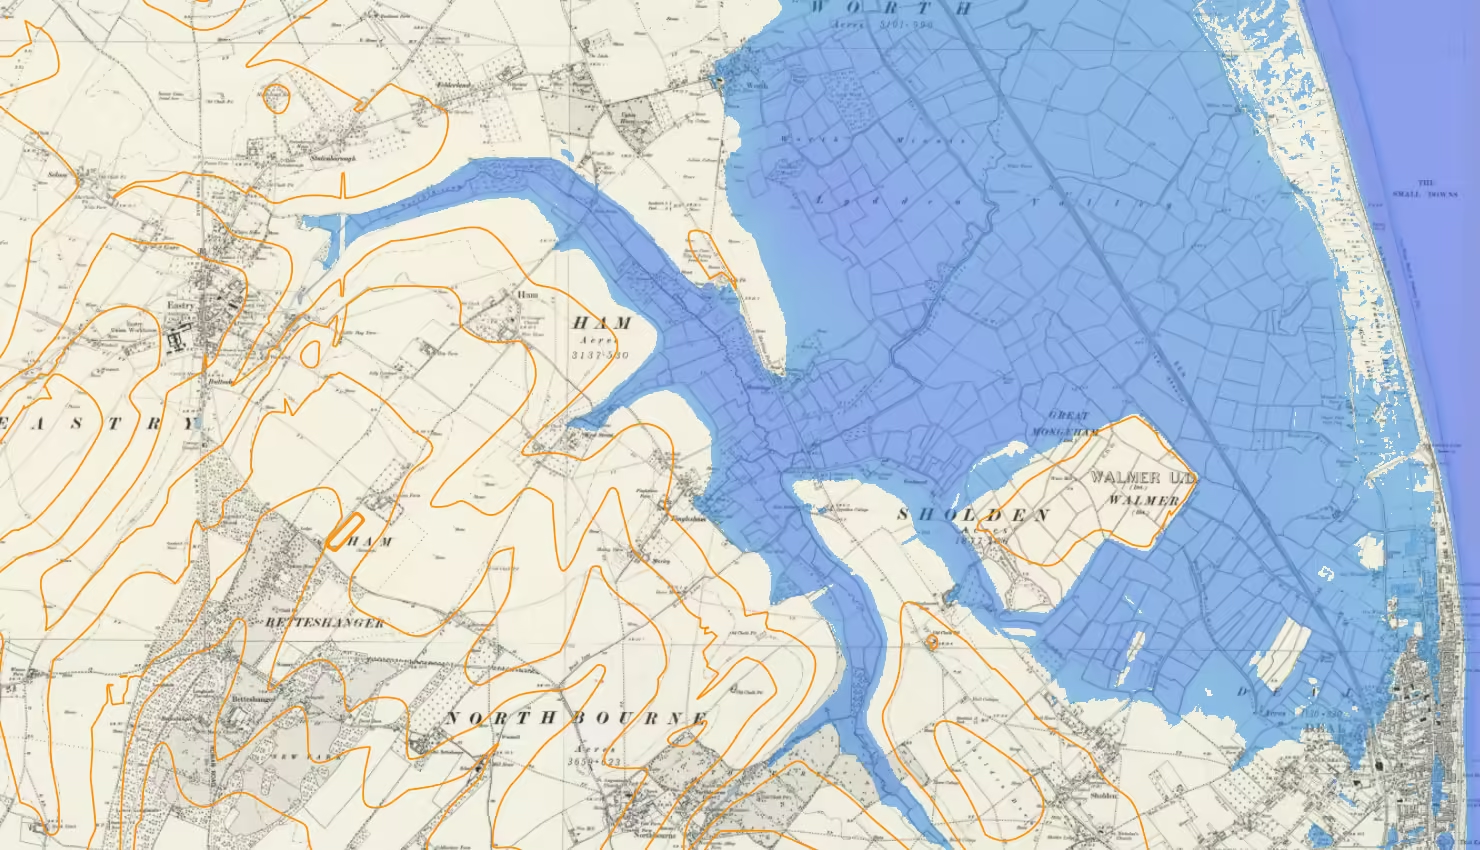
Ham’s Secret Water is an investigation into the historical coastline around Eastry and Ham in East Kent using open-source data and geographical information system, QGIS.
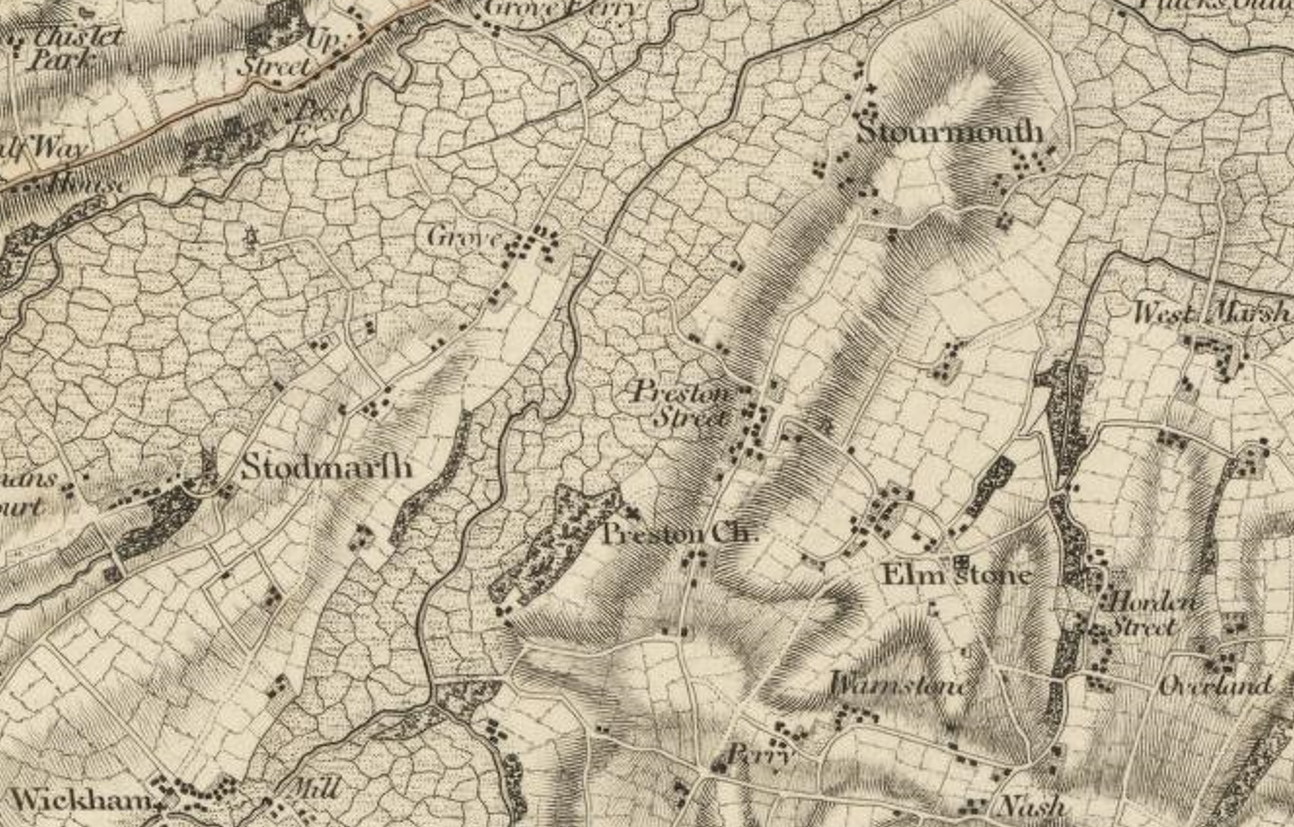
Preston, East Kent, is shown above on the Ordnance Surevy’s first published map of Kent in 1801, The County of Kent – map by William Mudge 1801, the first map published by the Ordnance Survey. I think that the area covered by the Wantsum Channel is essentially the marshes that are indicated so clearly on … Read more
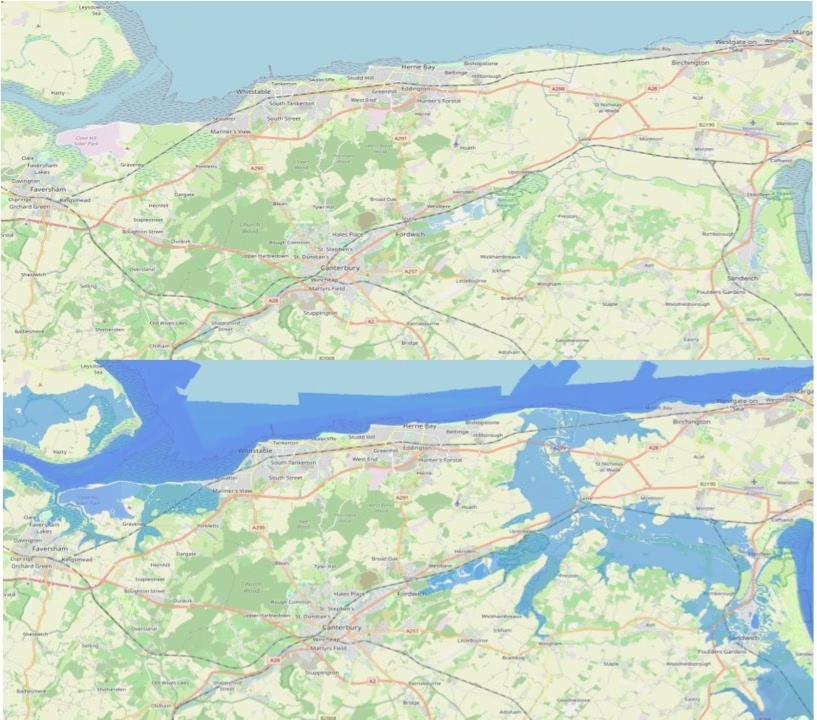
This post presents and animation of how the Wantsum Channel would look on Open Street Map by shading different elevations of Environment Agency sourced LiDAR data. A conclusion of the post is to present a possible medieval East Kent Coastline based on an elevation of 2.75 m.
This post presents and animation of how the Wantsum Channel would look on Mudge’s 1801 map by shading different elevations of Environment Agency sourced LiDAR data. A conclusion of the post is to present a possible medieval East Kent Coastline based on an elevation of 2.75 m.
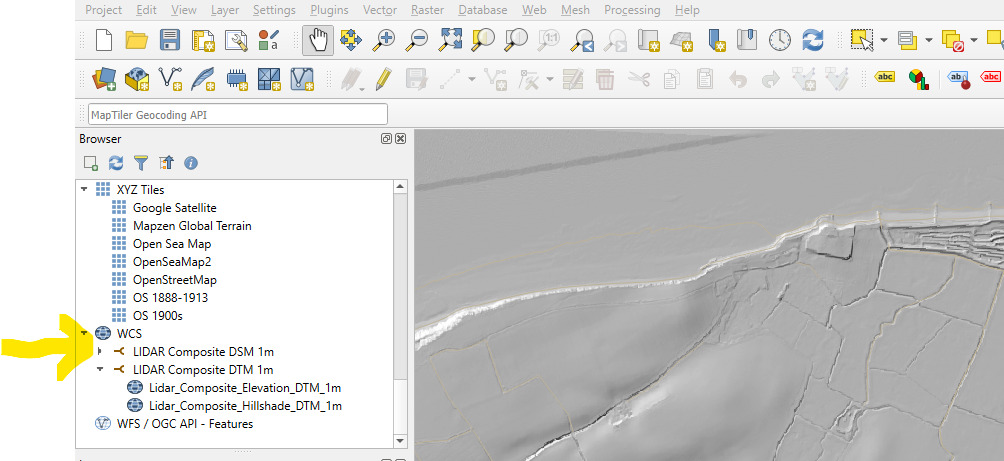
a short note about LIDAR and how to connect QGIS to LIDAR data released by the UK Environment Agency.