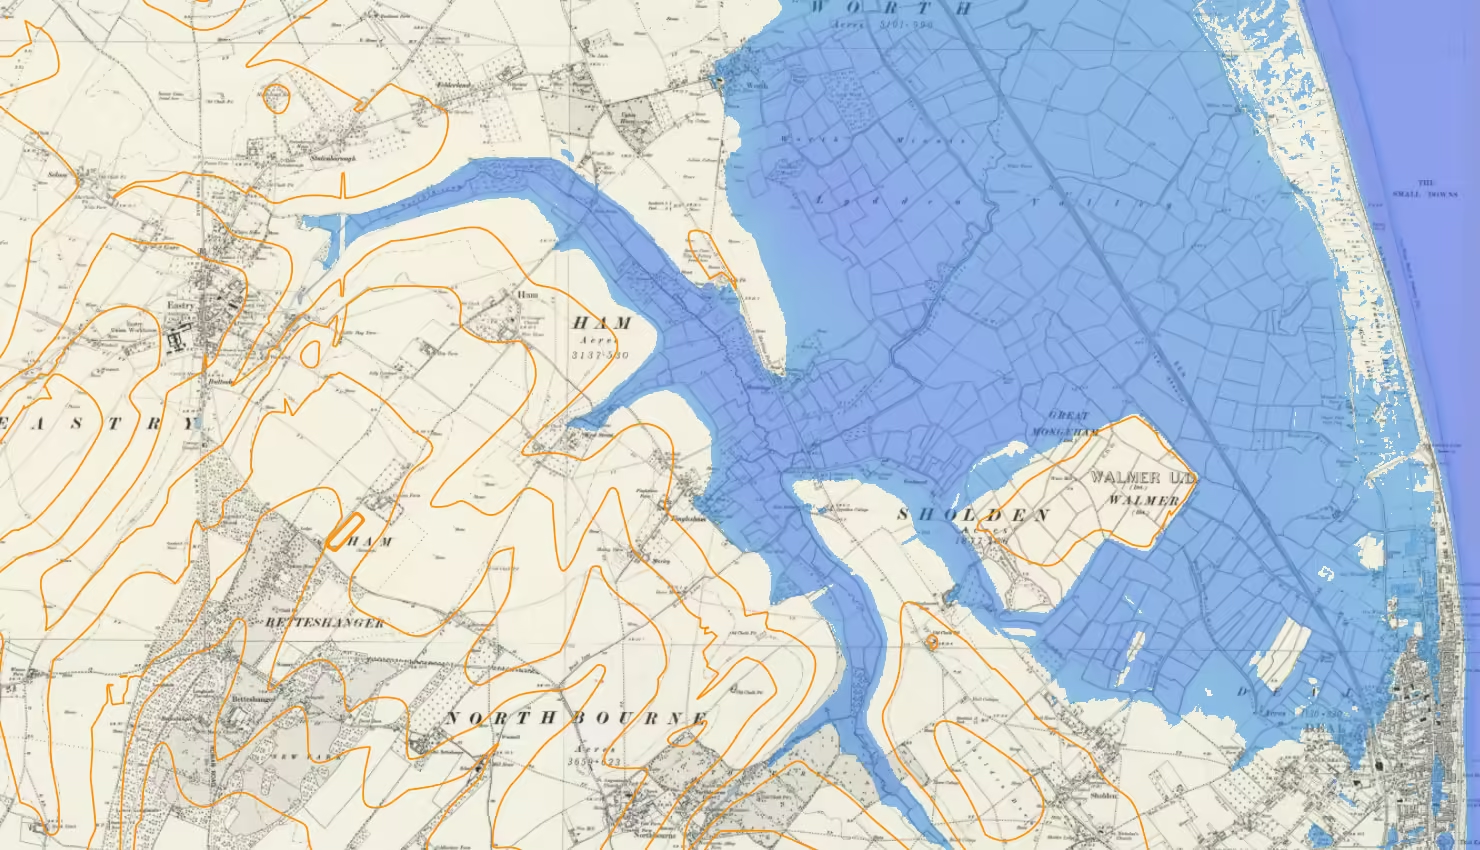
This post contains my notes and observations made when investigating the historical coastline around Eastry in Kent using open-source Geographical Information Systems, data and maps.
It seems to me that a few different factors influence the historical coast-line in this area.
Land Reclamation and Changes to the Wantsum Channel
Changes to the sand banks and coastline from Deal to Thanet caused the Wantsum Channel, which separated the then island of Thanet from mainland Kent, to silt up. New sea defences on the North and South coasts created a large area of low-lying marshland much of which has become farmland. Even with no sea level changes, parts of the landscape which were previously on the coast now lie some distance from the sea. This seems to the case in the vicinity of Eastry. See Searching for Kent’s Wantsum Channel on Historic OS Maps, Flooding up the Wantsum Channel on Mudge’s Map and Flooding the Wantsum Channel on Open Street Map
Climate Change
Analysed sea level rises in ‘2000 years of sea level‘ published on Real Climate presents the following summary:
- Stable sea level from 200 BC until 1000 AD
- A 400-year rise by about 6 cm per century up to 1400 AD
- Another stable period from 1400 AD up to the late 19th C
- A rapid rise by about 20 cm since.
This seems to imply that sea levels were about a metre lower in 2000 BP than today.
Isostatic Readjustment
The Earth’s crust floats on a mantle of molten rock. Weighed down by frozen water in the last ice age, it found new buoyancy as the climate warmed and the ice melted.
Isostatic readjustment, or movement since the last ice age, means that the land has been rising since 2000 BP. ‘Glacial isostatic adjustment of the British Isles: new constraints from GPS measurements of crustal motion‘, published in the Geophysical Journal Internation OUP seems to conclude that 2000 years might lead to an uplift in the land of 1-2 metres.
These different effects suggest that the historic sea level would be found at an elevation of 0.8-1.8 m.
Tides
The actual height of the sea, and hence the coastline at any instant, varies with the tide. It seems sensible to assume that settlements would have become established respecting local folk knowledge of where maximum spring tides would have reached thus avoiding a once-in-a-lifetime (or more) sea flooding experience. Ancient settlements do seem to be sited beyond such perils.
Studying the Coastline Using Lidar and Historical Maps
The Environment Agency (EA) makes LiDAR digital elevation data openly available. This offers a way of overlaying elevation data on openly available maps using GIS software. EA LiDAR elevations are given relative to Ordnance Datum (OD) but tidal heights are given relative to Chart Datum (CD). It is a bit of a surprise that the difference between OD and CD is not constant; the planet’s is distorted and rough and there is no simple geometry here. CD varies by location.
The difference between OD and CD is -2.9 at Sheerness and -3.67 m at Dover (National Tidal and Sea Level Facility). The negative here indicates that CD is at a lower level than OD. Hence a spring tide in the area forecast at 4.52 m (Ramsgate 7/6/24) would, in the absence of sea defences, have the potential to flood elevations to about 1.5 m above OD.
If we assumed similar tidal variations in 2000 BP then, assuming that the landscape was lower overall by 0.8-1.8 m, spring tides would have the potential to flood parts of the landscape which now lie at 2.3 to 3.3 m above OD.
All this leads to the conclusion that spring tides in 2000BP could be flooding 2.5-3.5 m above OD on the present landscape.
Kent is blessed to have one of the first accurate land maps. The Ordnance Survey map, due to Mudge gives a beautiful picture of Kent as it was in 1801. See the post on this blog, The County of Kent – map by William Mudge 1801, the first map published by the Ordnance Survey.
A closer look at the area around Eastry seems to show clearly where the nearby marshland lies.
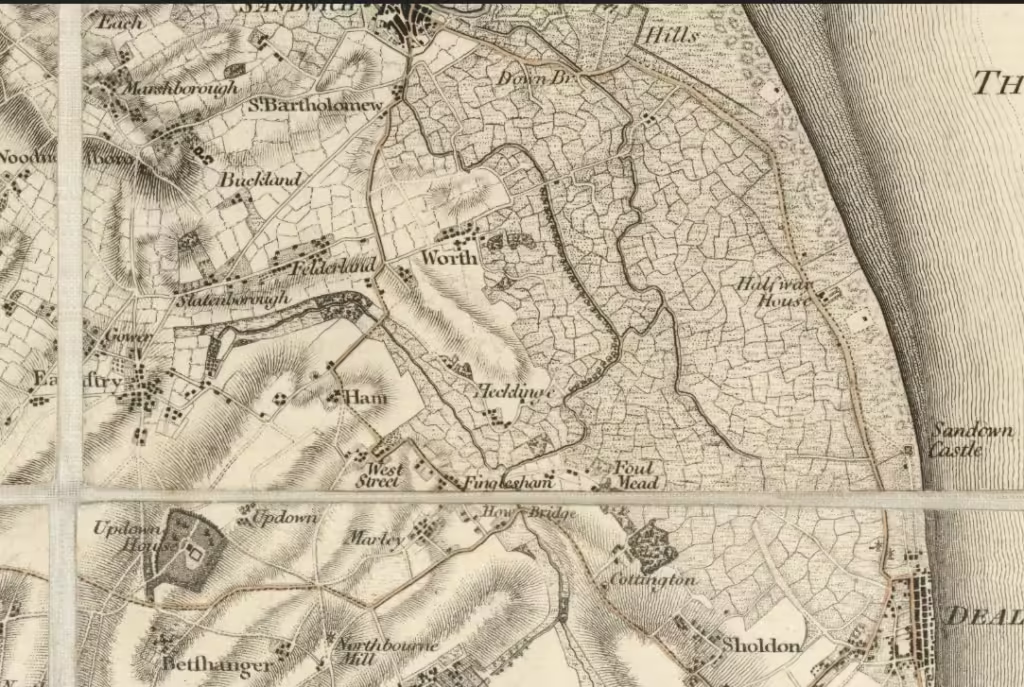
The relief of the land is shaded and the random patchwork of sewers and boundaries would seem to be the marshland and former tidal zone. If this is the case, Eastry would have been at the head of a tidal creek either side of which lay Ham and Hacklinge on raised ground. Finglesham is near the mouth of this creek. This looks like Ham’s Secret Water.
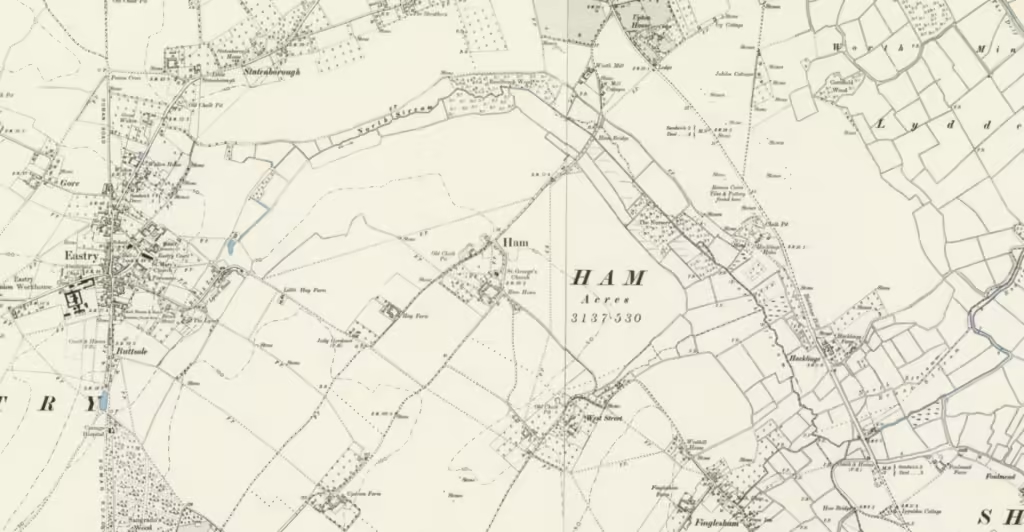
The OS 1888-1913 series of maps is an open-source resource which is very useful. The scale of these maps gives lots of detail, including some historical and archaeological sites. In this rural and marshy area, it seems that not much has changed in the 100 years, or so, since Mudge’s map.
Overlaying EA LiDAR data and shading this to 3.5 m above Ordnance Datum may give the height of a Spring Tide on this landscape. Current OS contours from the OS Zoomstack are overlayed on the map too, using QGIS. A secret water around Ham and Eastry opens up at high tide.
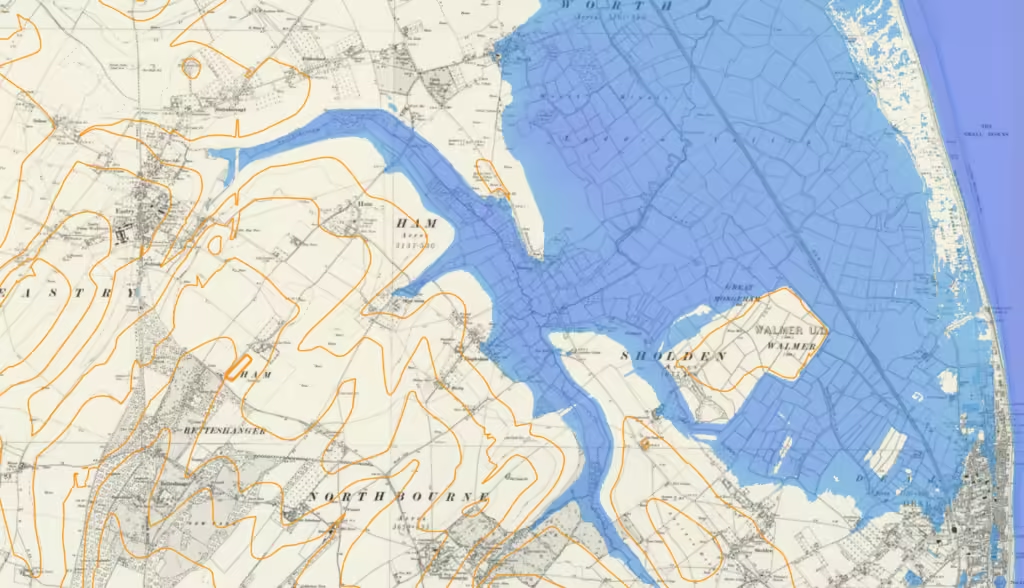
Current roads and buildings, from OS Open Zoomstack, can be overlayed too.

A close-up of Eastry and Ham follows.
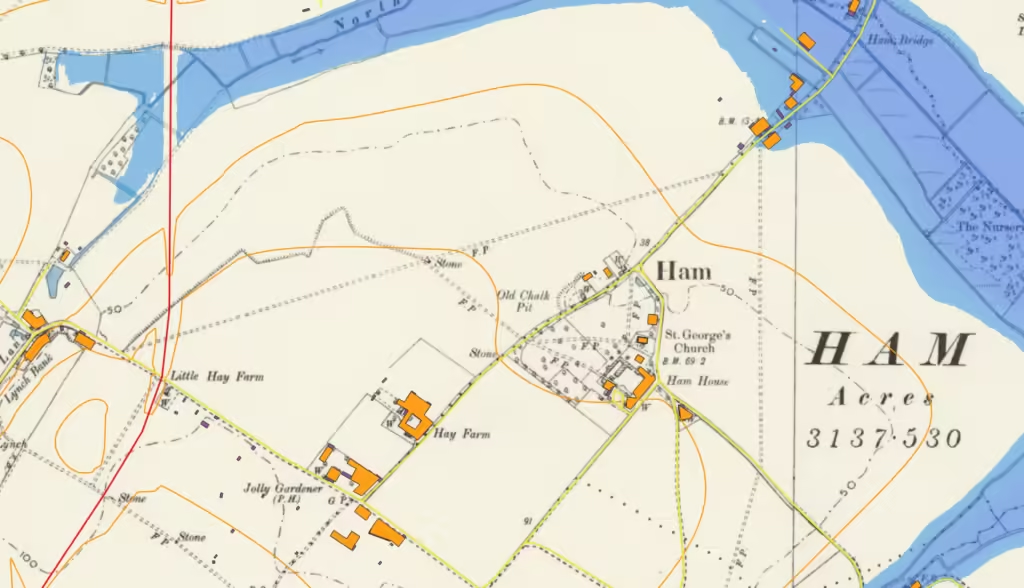
To the North West of Ham lies the newly identified Hacklinge Peninsular complete with locations of archeological finds.

There are many data source choices to be made. As a final image, I present the Eastry and Ham Secret Water area as seen on the current Open Street Map complete with the LiDAR shading to 3.5 m.

